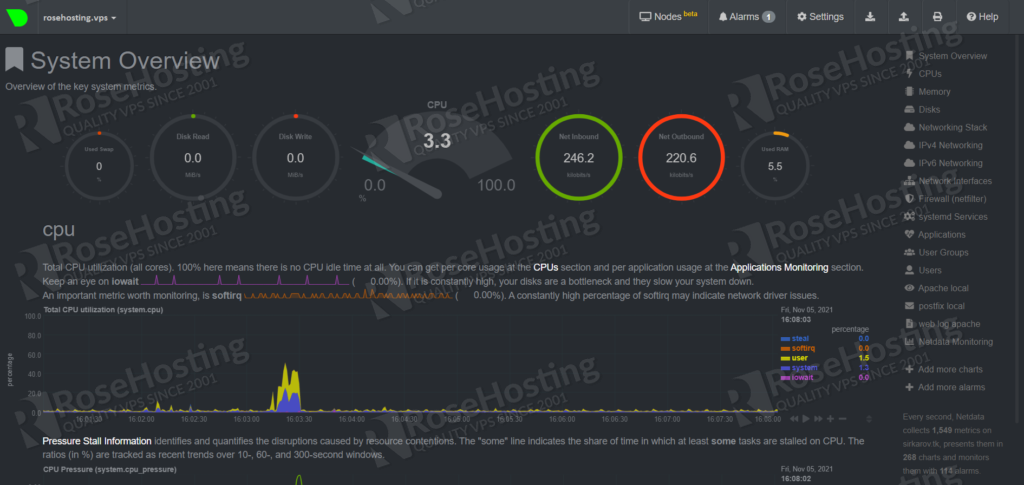
In this post, we are going to show you how to install Netdata Monitoring Software on your Debian 11 operating system.

Netdata is an open-source web-based monitoring system that provides real-time metrics such as CPU usage, disk activity, bandwidth usage, website visitors, and so on. All these metrics are collected and visualized into a perfect GUI that is very readable and understandable.
This monitoring software with its simplicity is usable by developers, system administrators, and even sometimes the owners of servers that are not very technically knowledgeable.
Installing Netdata on Debian 11 should take up to 10 minutes. Let’s get started!
Table of Contents
Prerequisites
- Fresh install of Debian 11
- User privileges: root or non-root user with sudo privileges
- VPS with at least 1GB of RAM (Our SSD 1 VPS plan)
Check the OS
Check the Operating system before you start with the steps for installing Netdata
hostnamectl
You should see the following output:
root@vps:~# hostnamectl
   Static hostname: rosehosting.vps
         Icon name: computer-vm
           Chassis: vm
        Machine ID: be3014108d530ef575a7cd9d690d9c84
           Boot ID: 9aab16e1549741bfa9e7a15388725cc2
    Virtualization: kvm
  Operating System: Debian GNU/Linux 11 (bullseye)
            Kernel: Linux 5.10.0-9-amd64
      Architecture: x86-64
root@vps:~# cat /etc/issue
Debian GNU/Linux 11 \n \l
Step 1. Update the system
It is recommended before installing something on the server, the system is up to date. That is why we are going to update the system before we start with the command below:
sudo apt update -y && sudo apt upgrade -y
Step 2. Install Netdata on Debian 11
Since the Netdata is by default in the repository of Debian 11, we do not need to import anything like keys and repositories. We just need to execute the following command:
sudo apt-get install netdata -y
Once, the installation is complete you need to start the netdata service:
sudo systemctl start netdata
After starting the service, the next step is to enable it in order the service starts automatically on server reboot:
sudo systemctl enable netdata
To check the status of netdata service and verify that everything is running properly, execute the command below:
sudo systemctl status netdata
You should see the following output:
root@vps:~# sudo systemctl status netdata
● netdata.service - netdata - Real-time performance monitoring
     Loaded: loaded (/lib/systemd/system/netdata.service; enabled; vendor preset: enabled)
     Active: active (running) since Fri 2021-11-05 08:28:35 EDT; 6min ago
       Docs: man:netdata
             file:///usr/share/doc/netdata/html/index.html
             https://github.com/netdata/netdata
   Main PID: 2076 (netdata)
      Tasks: 30 (limit: 4678)
     Memory: 72.7M
        CPU: 52.693s
     CGroup: /system.slice/netdata.service
             ├─2076 /usr/sbin/netdata -D
             ├─2101 /usr/sbin/netdata --special-spawn-server
             ├─2379 /usr/lib/netdata/plugins.d/nfacct.plugin 1
             ├─2382 bash /usr/lib/netdata/plugins.d/tc-qos-helper.sh 1
             ├─2386 /usr/bin/python3 /usr/lib/netdata/plugins.d/python.d.plugin 1
             └─2409 /usr/lib/netdata/plugins.d/apps.plugin 1

Nov 05 08:28:35 rosehosting.vps netdata[2076]: 2021-11-05 08:28:35: netdata INFO  : MAIN : Created file '/var/lib/netdata/dbengine_multihost_size' to store the computed value
Another way to check if there is a running process of netdata, execute the following command:
netstat -tunlp | grep 19999
You should get the following output
root@vps:~# netstat -tunlp | grep 19999
tcp        0      0 127.0.0.1:19999         0.0.0.0:*               LISTEN      2076/netdata
Step 3. Configure Netdata
Even if the installation is successful and the service is running on port 19999 we need to configure the Netdata to be accessible on our server IP address.
Open the /etc/netdata/netdata.conf with an editor by your choice and set the “bind socket to IP” to your servers IP address:
# NetData Configuration

# The current full configuration can be retrieved from the running
# server at the URL
#
#   http://localhost:19999/netdata.conf
#
# for example:
#
#   wget -O /etc/netdata/netdata.conf http://localhost:19999/netdata.conf
#
[global]
run as user = netdata web files owner = root web files group = root # Netdata is not designed to be exposed to potentially hostile # networks. See https://github.com/netdata/netdata/issues/164 bind socket to IP = YOUR_SERVER_IP_ADDRESS
Save the file, close it and restart the netdata service
sudo systemctl restart netdata
Step 4. Enable Firewall
The next step is to open port 19999 in the firewall so you can access the Netdata in your browser
sudo ufw allow 19999/tcp
Reload the UFW Firewall
sudo ufw reload
If you have iptables on your server you can execute the following command:
sudo iptables -I INPUT -p tcp --dport 19999 -j ACCEPT
Save the Iptables rules
iptables-save
To check if the port is opened in iptables execute the command:
sudo iptables -nvL | grep 19999
You should see the input below:
root@vps:~# sudo iptables -nvL | grep 19999
 2076  661K ACCEPT     tcp  --  *      *       0.0.0.0/0            0.0.0.0/0            tcp dpt:19999
Step 5. Access Netdata in Browser
To access the Netdata dashboard access your server IP address with the port as described below:
http://YOUR_SERVER_IP_ADDRESS:19999
You should see the screen below:

Congratulations. You successfully installed and configured the Netdata monitoring software on your Debian 11 VPS. Also, you learned how to enable ports in firewalls such as UFW and Iptables.
Of course, you don’t have to install Netdata on Debian 11, if you use one of our NVMe VPS Hosting plans, in which case you can simply ask our expert Linux admins to install the Netdata monitoring tool on Debian 11 for you. They are available 24×7 and will take care of your request immediately.
If you liked this post on how to install Netdata on Debian 11, please share it with your friends on the social networks using the buttons on the left or simply leave a reply below. Thanks.